Assignment 2
Assignment 2
posted Tuesday 6 February 2018
due Tuesday 20 February 2018 at 11:59pm
Submission policy: Report all plots and your code in this Jupyter notebook. Print your notebook as a PDF and attach it to the rest of your assignment. Turn in your assignment through Gradescope.
Question I: Lander-Waterman and repeat statistics
In Question III of the last problem set, you aligned reads from an E. coli sequencing experiment to the E. coli genome using Bowtie2, obtaining 627862 aligned reads (out of 644022 total reads). Download the set of aligned reads here (the alignments are saved as a *.bam file). You will be using SAMtools for this problem. You can install SAMtools on the Stanford Rice cluster using the following commands:
wget http://data-science-sequencing.github.io/Win2018/assets/assignment2/install_samtools.sh
bash install_samtools.sh <SUNETID>
- You can view the first 15 lines of the file using the command
samtools view ecoli_aligned_reads.bam | head -15. Refer to the documentation for the *.sam file format here. Convert the *.bam file to a *.sam file using thesamtools viewcommand. What position does the first read align to? - The length of the E. coli genome is 4639675. Write a function to compute the proportion of the genome by covered by the reads in a given *.sam file. What proportion of the genome is covered by the reads in ecoli_aligned_reads.bam?
- Subsample the *.sam file using the
samtools view -scommand. You should generate a new *.sam file for each subsampling. Using the function you wrote above, plot the proportion of the genome covered as a function of \(p\), the proportion of reads kept. Interpret what you see (1-2 sentences). - Compute the triple repeat and interleaved statistics of the E. coli genome (available here). Report the number of triple and interleaved repeats of length more than 200. Consider only the forward strand of the reference. Hint: Use the software MUMmer. The
repeat-matchcommand might be helpful. You can install MUMmer on the Stanford Rice cluster using the following commands:
wget http://data-science-sequencing.github.io/Win2018/assets/assignment2/install_mummer.sh
bash install_mummer.sh
You may also use pysam for this problem.
Question II: de Bruijn graph assembly
-
Give the 5-mer spectrum of TAAAAACCCCAAAAAG. How many different assemblies are consistent with the 5-mer spectrum?
-
The support of a \(k\)-mer spectrum is the \(k\)-mer spectrum with the value of all non-zero \(k\)-mers set to 1. Give the assembly of TAAAAACCCCAAAAAG from the support of its 5-mer spectrum. How many different assemblies are consistent with the support of this 5-mer spectrum?
-
Study the implementation of the de Bruijn graph assembler by Ben Langmead here. You should copy and paste the code from the top cell into your notebook as you will use a tweak of this class to perform assembly. (You will need to make sure that the assembly is done using the k-mers of non-zero support. That is, even if a k-mer is seen twice one would add only an edge between the k-1 mers.) Note that you will need to pass a list of reads (strings) as the
strIterargument when initializing an instance of the class (see__iter___). You can use theeulerianWalkOrCyclemethod to obtain a list of \(k-1\)-mers corresponding to an Eulerian walk through the graph. Write a function that obtains the assembly from this list of \(k-1\)-mers (i.e. if the list is [‘ABCD’,’BCDE’] with \(k=5\), then your function should return ‘ABCDE’). -
Write a function to generate random reads. The input should be the number of reads generated \(N\) and the length \(L\) of each read generated. The output should be \(N\) random length-\(L\) sequences of nucleotides. Generate a random length-100 genome.
-
Write a function to sample reads from a genome. The input should be the genome, the number of reads generated \(N\), and the length \(L\) of each read generated. Assuming that \(L = 10\), how many reads do you need to achieve a coverage depth of 30? Generate this number of reads and give the assembly using your code from part 3.
-
Write a modified version of the previous function for sampling reads from a genome with error. Generate random length-10 reads with 5% error rate and a coverage of 30. Give the assembly using your code for part 3. What do you observe? You may want to rerun your code for 4-6 to make sure your observations are consistent.
Question III: Viterbi Algorithm
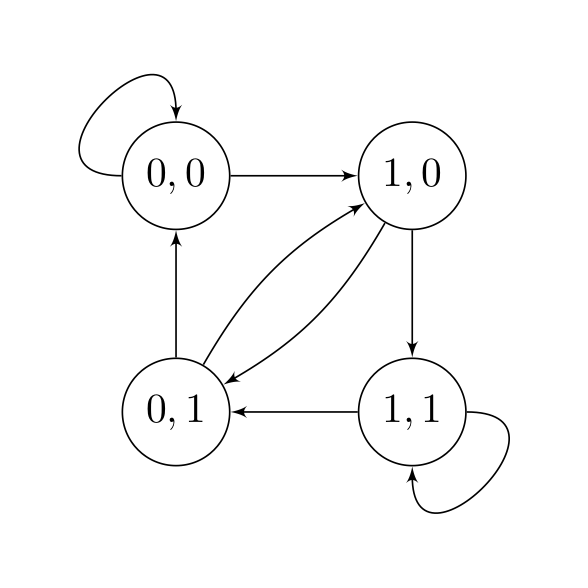
Consider the following state diagram for a simplified Nanopore sequencer only sequencing two bases 0 and 1.
-
The state space here is \(\{00, 01, 10, 11\} \\). What can you say about the inter-symbol interference? In other words, how many nucleotides are in the pore at each sampling?
-
Consider the output sequence \(1.34, 0.23, 1.45, 0.5, 0.11\). Using the above state diagram, compute the sequence obtained by Viterbi decoding. Assume that each observed \(y_i\) is a weighted linear combination of the symbols in the context plus some noise: \(y_i = 0.9 s_i + 0.25 s_{i-1} + n_i\). Assume that the added noise is Gaussian with zero mean.
-
Simulate several length-20 \(s\). Use these to simulate \(y\) where \(n\) is sampled from a \(\mathcal{N}(0, \sigma^2)\) distribution. Decode \(y\) using the your Viterbi algorithm. Report the average edit distance between your recovered \(s\) and the actual \(s\) as a function of \(\sigma\). Test for \(\sigma =\) 1e-3, 1e-2, 1e-1, 1e0, 1e1. You can use the editdistance Python package to compute edit distance.
-
Repeat 3 except randomly delete a base in \(s\) before generating your \(y\). What do you observe? From a high level, what might you need to change to fix this?